
Practical Guides & Insights

Clear thinking on business data, dashboards and software.

Written for non-technical and technical leaders alike—covering how to design useful dashboards, avoid reporting traps, connect cloud systems safely, and decide when spreadsheets warrant custom software.

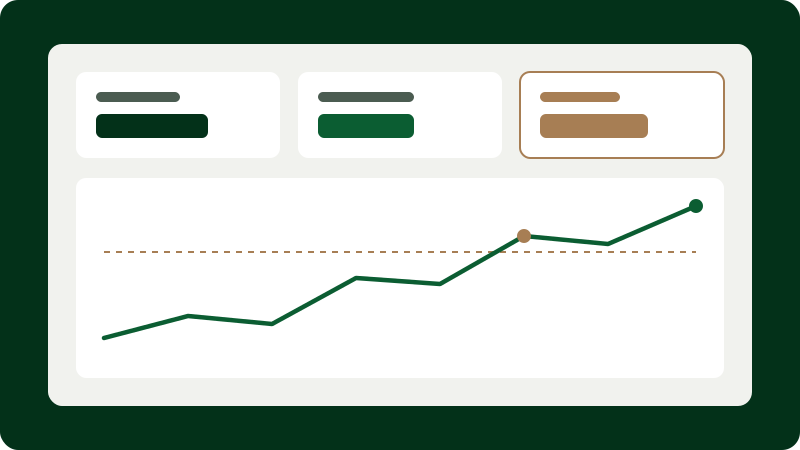
Illustration for How to Design a Business Dashboard That Drives Decisions
Dashboard Design7 min read

How to Design a Business Dashboard That Drives Decisions

Most underused business dashboards fail not because the database query is wrong, but because the screen tries to answer every question for every department at once. A decision-ready dashboard starts with a specific role, a recurring choice, and clear thresholds for action.

In this guide

  • Separate strategic, operational and analytical views rather than crowding all metrics onto one screen.
  • Pair every headline number with a comparison baseline—such as target, prior period or capacity threshold.
By Aussi Dash Editorial TeamRead full guide →
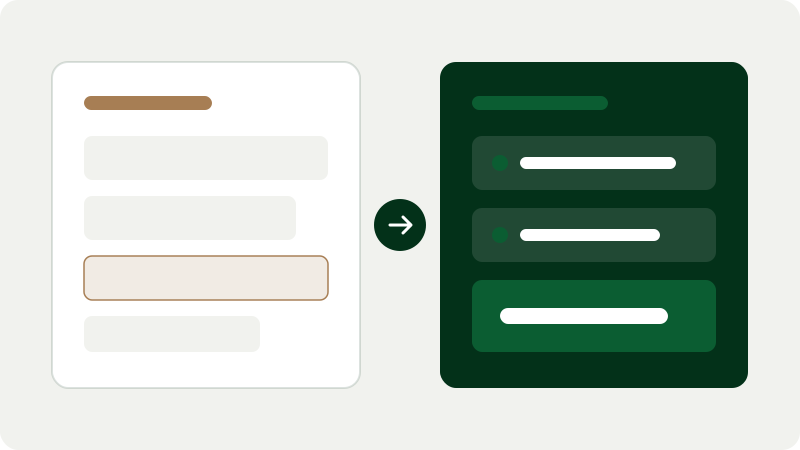
Illustration for Five Reporting Mistakes Growing Businesses Should Avoid
Business Intelligence6 min read

Five Reporting Mistakes Growing Businesses Should Avoid

When a business has ten staff, informal spreadsheet reporting usually works fine. As headcount, service lines and software tools multiply, small reporting shortcuts compound into hours of monthly reconciliation and costly blind spots.

In this guide

  • Unwritten metric definitions cause departments to bring conflicting numbers to leadership meetings.
  • Manual CSV copy-pasting introduces silent row truncation, timezone shifts and formula overwrites.
By Aussi Dash Editorial TeamRead full guide →

Illustration for When to Replace Spreadsheets with a Custom Web Application
Custom Software7 min read

When to Replace Spreadsheets with a Custom Web Application

Spreadsheets are arguably the most flexible business tool ever invented. Replacing every spreadsheet with custom software would be wasteful—yet keeping core operational workflows inside an outgrown workbook quietly taxes productivity and increases error risk.

In this guide

  • Keep spreadsheets for ad-hoc financial modelling, one-off analysis and small single-owner trackers.
  • Consider a custom web application when multiple roles need different permissions, concurrent editing, input validation or field-level audit history.
By Aussi Dash Editorial TeamRead full guide →

Illustration for A Practical Guide to Connecting Business Systems with APIs
System Integration8 min read

A Practical Guide to Connecting Business Systems with APIs

Connecting your CRM, job management software and accounting platform through Application Programming Interfaces (APIs) removes hours of repetitive re-keying. Yet the difference between a dependable integration and an integration headache lies in how edge cases, retries and security are engineered.

In this guide

  • Define a single “source of truth” per data field before writing integration logic so systems do not overwrite one another in loops.
  • Use idempotency keys and external ID mapping so network retries never create duplicate invoices or customer records.
By Aussi Dash Editorial TeamRead full guide →

Illustration for Data Visualisation Principles for Non-Technical Teams
Data Visualisation6 min read

Data Visualisation Principles for Non-Technical Teams

Your operations coordinators, warehouse leads and board members should never need a statistics degree to read a weekly performance report. Clear data visualisation reduces cognitive load so anyone on the team spots real movement immediately.

In this guide

  • Match chart geometry to the question: line charts for trends over time, horizontal bars for category rankings, and structured tables when exact figures matter.
  • Start bar-chart axes at zero so visual bar length stays proportional to numerical value.
By Aussi Dash Editorial TeamRead full guide →

Working through one of these challenges right now?

Explore our 10 software and data services or send a quick question to our engineering team.

Ask a question