
How to Design a Business Dashboard That Drives Decisions
By Aussi Dash Editorial Team
Most underused business dashboards fail not because the database query is wrong, but because the screen tries to answer every question for every department at once. A decision-ready dashboard starts with a specific role, a recurring choice, and clear thresholds for action.
Key Takeaways
- Separate strategic, operational and analytical views rather than crowding all metrics onto one screen.
- Pair every headline number with a comparison baseline—such as target, prior period or capacity threshold.
- Make data freshness and metric formulas visible so teams spend meetings acting on numbers rather than debating them.
- Follow WCAG 2.2 contrast and non-colour cues so status indicators remain readable on phones, monitors and projectors.
1. Start with the decision, not the database table
When teams scope a new dashboard by listing every column available in their CRM, accounting software and job system, the result is usually a crowded wall of gauges that staff stop opening after two weeks.
Before sketching a single chart, write down who opens the screen, how often they check it, and what concrete action they can take when a number moves outside its normal range. If no realistic operational action maps to a metric, demote it to a secondary report or drop it altogether.
- Dispatch coordinator (checked hourly): Which jobs risk missing today’s service window and need reassignment?
- Operations manager (checked daily): Where is backlog accumulating across states or teams this week?
- Managing director (checked weekly/monthly): Are gross margin, cash collection and delivery capacity tracking to plan?
2. Give every number a baseline and context
A standalone card reading “42 open tickets” tells a viewer almost nothing. Forty-two could represent a quiet Tuesday or double the team’s safe capacity. Context transforms raw counts into operational signal.
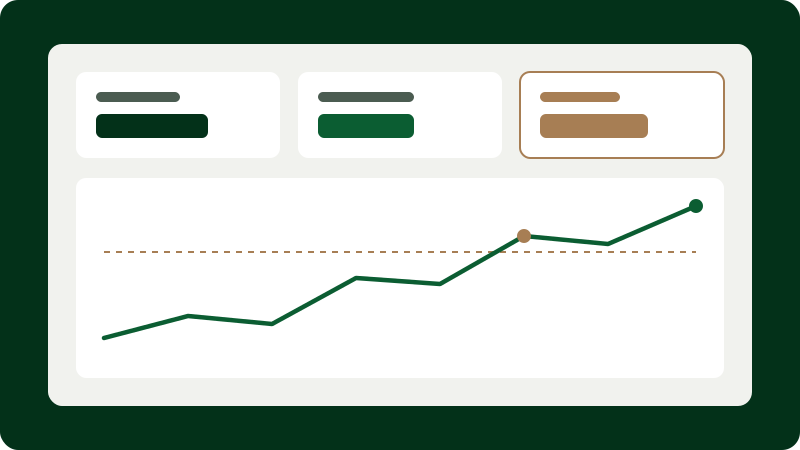
Attach concise comparison cues directly alongside primary figures: variance against target, a rolling four-week sparkline, or capacity bands. Keep comparisons consistent across the screen so readers do not have to mentally switch between month-to-date on one card and rolling 30 days on the next.
3. Organise visual hierarchy for scanning
Busy managers scan interfaces rather than reading them top-to-bottom like a novel. Place the three to five primary outcome indicators in the upper band, diagnostic trend breakdowns in the middle band, and row-level exception tables at the bottom where users can act on individual items.
Resist decorative chart elements—such as 3D bars, radial gauges or dual-axis spaghetti lines—that distort proportion or force unnecessary eye movement.
4. Build trust through visible data freshness and accessibility
Nothing erodes adoption faster than silent staleness. Always display a plain timestamp indicating when upstream sources last synchronised (for example, “Synced 14 mins ago from Xero & job queue”) and flag delayed feeds visibly.
Equally important, follow Web Content Accessibility Guidelines (WCAG 2.2) for non-text contrast and colour independence. Pairing high-contrast text badges (“Delayed”, “On track”) with icons ensures staff with colour-vision deficiency—or anyone viewing a washed-out meeting-room screen—reads status accurately.
Frequently asked questions
How many KPIs should appear on a single executive or operational dashboard?
In practice, 4 to 7 primary headline indicators supported by a small set of trend and exception views works well. If more than a dozen metrics compete for top-level prominence, split the view by role or workflow stage.
Should a dashboard update in real time?
Only if decisions happen in real time—such as live dispatch or queue management. Financial and utilisation indicators are often clearer and less distracting when refreshed hourly or daily.
Standards & authoritative references
Web Content Accessibility Guidelines (WCAG) 2.2 — Use of Color (1.4.1) & Non-text Contrast (1.4.11)
World Wide Web Consortium (W3C) — https://www.w3.org/TR/WCAG22/
Data Visualisation: Charts — Guidance on Designing Clear Statistical Graphics
UK Government Analysis Function — https://analysisfunction.civilservice.gov.uk/policy-store/data-visualisation-charts/