
Dashboards & Analytics
Data Visualisation and Reporting
Communicate trends, variances and operational risks clearly—using perceptual design principles rather than decorative chart clutter.
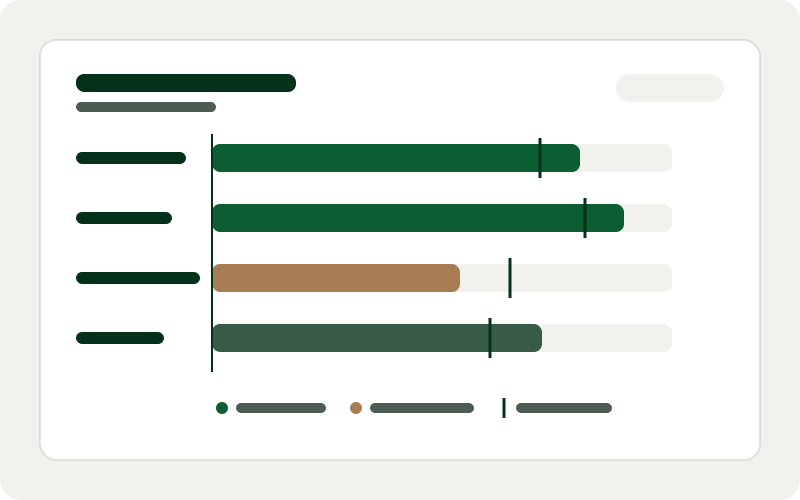
Even accurate data fails to drive action when presented as walls of tiny numbers, 3D pie charts or rainbow-coloured gauges that obscure variance. Good data visualisation respects human visual perception: clear baselines, meaningful comparisons, colourblind-safe palettes and concise annotations.
We redesign management packs, board summaries, operational scorecards and automated recurring reports so every chart answers a specific business question at a glance.
Target Variance
+4.8%
vs quarterly plan
Cycle Time
2.4 days
Down from 3.1 days
Colour Contrast
WCAG AA
Palette verified
Typical Architecture Layers
- 1Question Framing
- 2Chart Type Selection
- 3Accessible Visual Encoding
- 4Automated Report Delivery
Deliverables & scope boundaries
Clear boundaries prevent project surprises. Below is what a typical data visualisation and reporting engagement includes—and what sits outside scope unless separately agreed.
What this service includes
- Redesign of existing board packs, operational scorecards and recurring management reports
- Selection of appropriate chart forms (bullet graphs, sparklines, cohort tables, small multiples)
- WCAG-conscious colour palettes legible on screens, projectors and printed PDFs
- Automated scheduled generation of weekly or monthly report views
- Visual style guide so internal staff can keep future charts consistent
Explicitly excluded from standard scope
- Graphic design for consumer advertising campaigns or brand logo creation
- Copywriting of statutory annual reports or investor prospectuses
Who this service suits
- Leadership teams tired of spending half of every meeting explaining how to read a chart
- Operations and programme teams reporting compliance, delivery or service metrics to boards or clients
- Organisations wanting consistent, accessible visual standards across internal tools
Inputs needed from your team
To keep delivery smooth and avoid assumptions, we ask your team for:
- De-identified copies of 2–3 recent reports your team currently distributes
- Clarity on who reads each report and what decisions follow from it
- Brand typography or colour preferences where applicable
How delivery works
Step 01
Report Review
Examine existing packs with actual readers to spot confusion points, missing context and redundant visuals.
Step 02
Visual Prototyping
Test clean chart layouts using real historical distributions, outliers and edge cases.
Step 03
Automation & Templating
Wire approved report layouts to live or scheduled datasets so manual copy-pasting disappears.
Step 04
Style Guide Handover
Deliver templates, colour tokens and annotation guidelines for ongoing internal use.
Common questions about data visualisation and reporting
Can reports be exported cleanly to PDF or shared with stakeholders offline?
Yes. Where stakeholders review packs in board meetings or offline environments, we build print-aware CSS and structured export layouts alongside interactive browser views.
How do you make charts accessible for colour-vision deficiency?
We never rely on red/green hue alone to convey status—combining high-contrast luminance steps with directional icons, direct labels and clear reference lines.
Do you help simplify the number of metrics on a report?
Yes. Trimming vanity indicators and grouping metrics into primary outcomes versus diagnostic drivers is one of the highest-value parts of the engagement.
Related services
Discuss data visualisation and reporting for your business
Share a short overview of your current tools and goals—we will outline a practical scope, expected inputs and sensible next steps.